Very early career, judge me less for this one.
I can write about this incident in detail because this was my own startup, and I was the one-man tech team for about two years.
20th Feb night
Anoop called me saying users could not log in to the website.
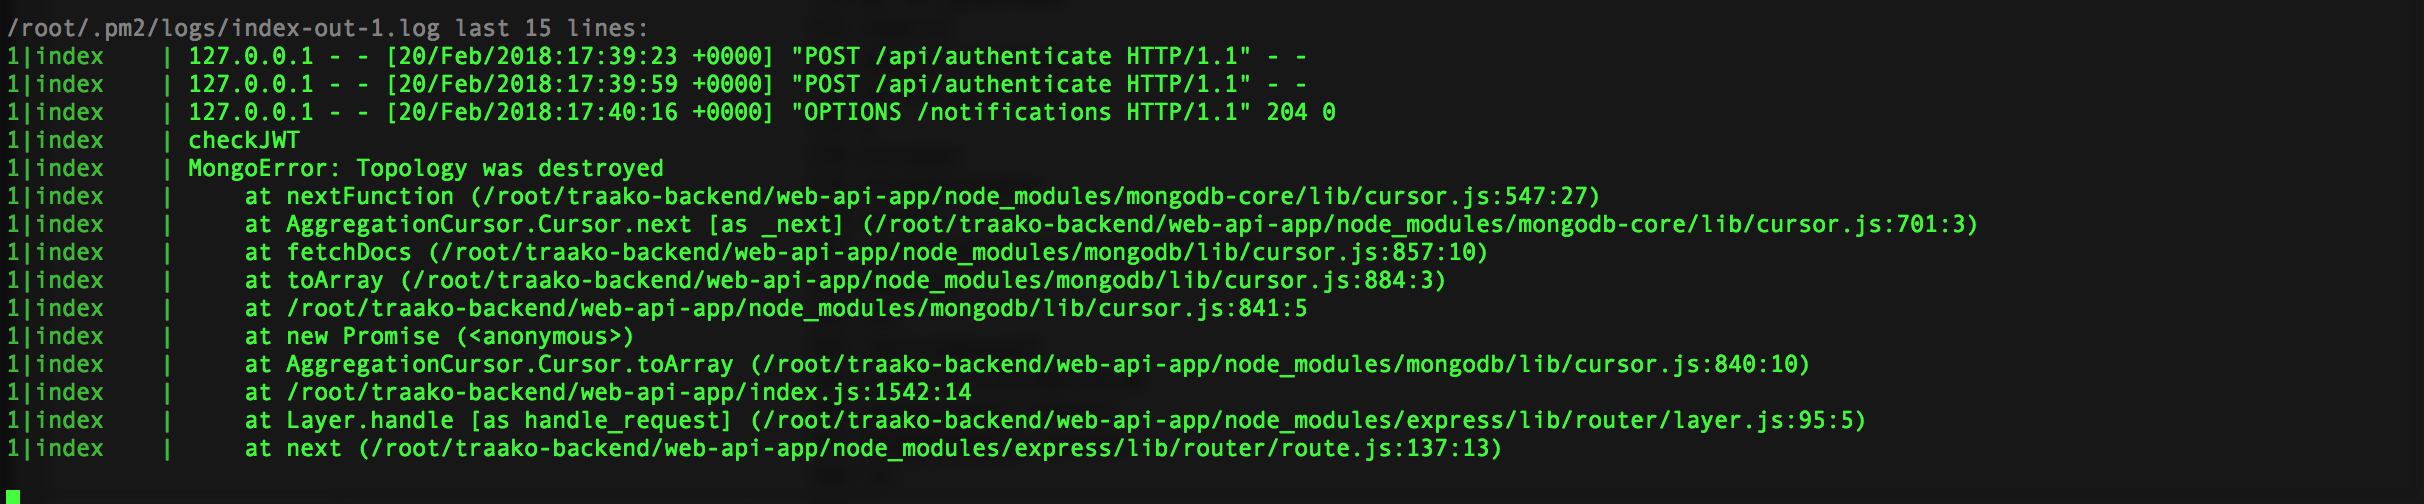
I opened the web app server and saw a Mongo “topology destroyed” error. I took a screenshot.
I went to the Mongo server and opened the Mongo shell. It was working, which confused me.
I restarted Mongo anyway:
$ sudo service mongod restart
I tried logging in on traako.com again and login started working. /dashboardvis was still not working.
I went back to the Mongo droplet and opened redis-cli. Redis was not reachable.
I started Redis manually:
$ cd redis/redis-stable/src && ./redis-server /root/redis/redis.conf
After that, Redis was working again too.
Then in the receiver logs I saw this:
cannot read property 'length' of undefined
1|index    |     at notifyruleonset (/root/traako-backend/receiver-app/eventing_onset.js:305:28)
This was coming from record.curgeofences.length, so I commented out the relevant code.
Then I also saw this:
SyntaxError: Unexpected token < in JSON at position 0
1|index    |     at JSON.parse (<anonymous>)
1|index    |     at Request._callback (/root/traako-backend/receiver-app/smsandreversegeocode.js:38:22)
I diagnosed it and found out that Nominatim had failed. It was returning an HTML error page instead of JSON because PostgreSQL was not accepting more connections:
<p><b>Message:</b> Failed to establish database connection</p>
<p><b>SQL Error:</b> DB Error: connect failed</p>
<p><b>Details:</b> <pre><pre>
[nativecode=pg_connect(): Unable to connect to PostgreSQL server: FATAL:  remaining connection slots are reserved for non-replication superuser connections] ** pgsql://@/nominatim</pre></pre></p></body></html>
I ran:
docker container ls
docker exec -it fa81c454f053 service postgresql restart
Postgres restarted, and Nominatim started working again. Further, I checked the DigitalOcean graphs for the Nominatim server. Since around 9 PM there had been no private data transfer and CPU usage had dropped to 0. At this point it was 11:43 PM. Around 11 PM there were large spikes in private data transfer and CPU usage.
I checked other graphs too, and several of them were showing strange patterns.
Questions I had at that time:
- How do I get notified better next time?
- How should I handle backups?
- Why did Redis fail?
- If Redis failed, why did I see the Mongo topology destroyed error?
- Why did Nominatim fail?
21st Feb
On 21st Feb, I received an error saying 98% devices were down.
I could not SSH into the receiver server. It looked powered off, and I could not power it on initially. Then I managed to power it on.
Nominatim failed again.
I restarted Postgres on the Nominatim box.
A few moments later, I could not SSH into the web app server either. This is what I saw:
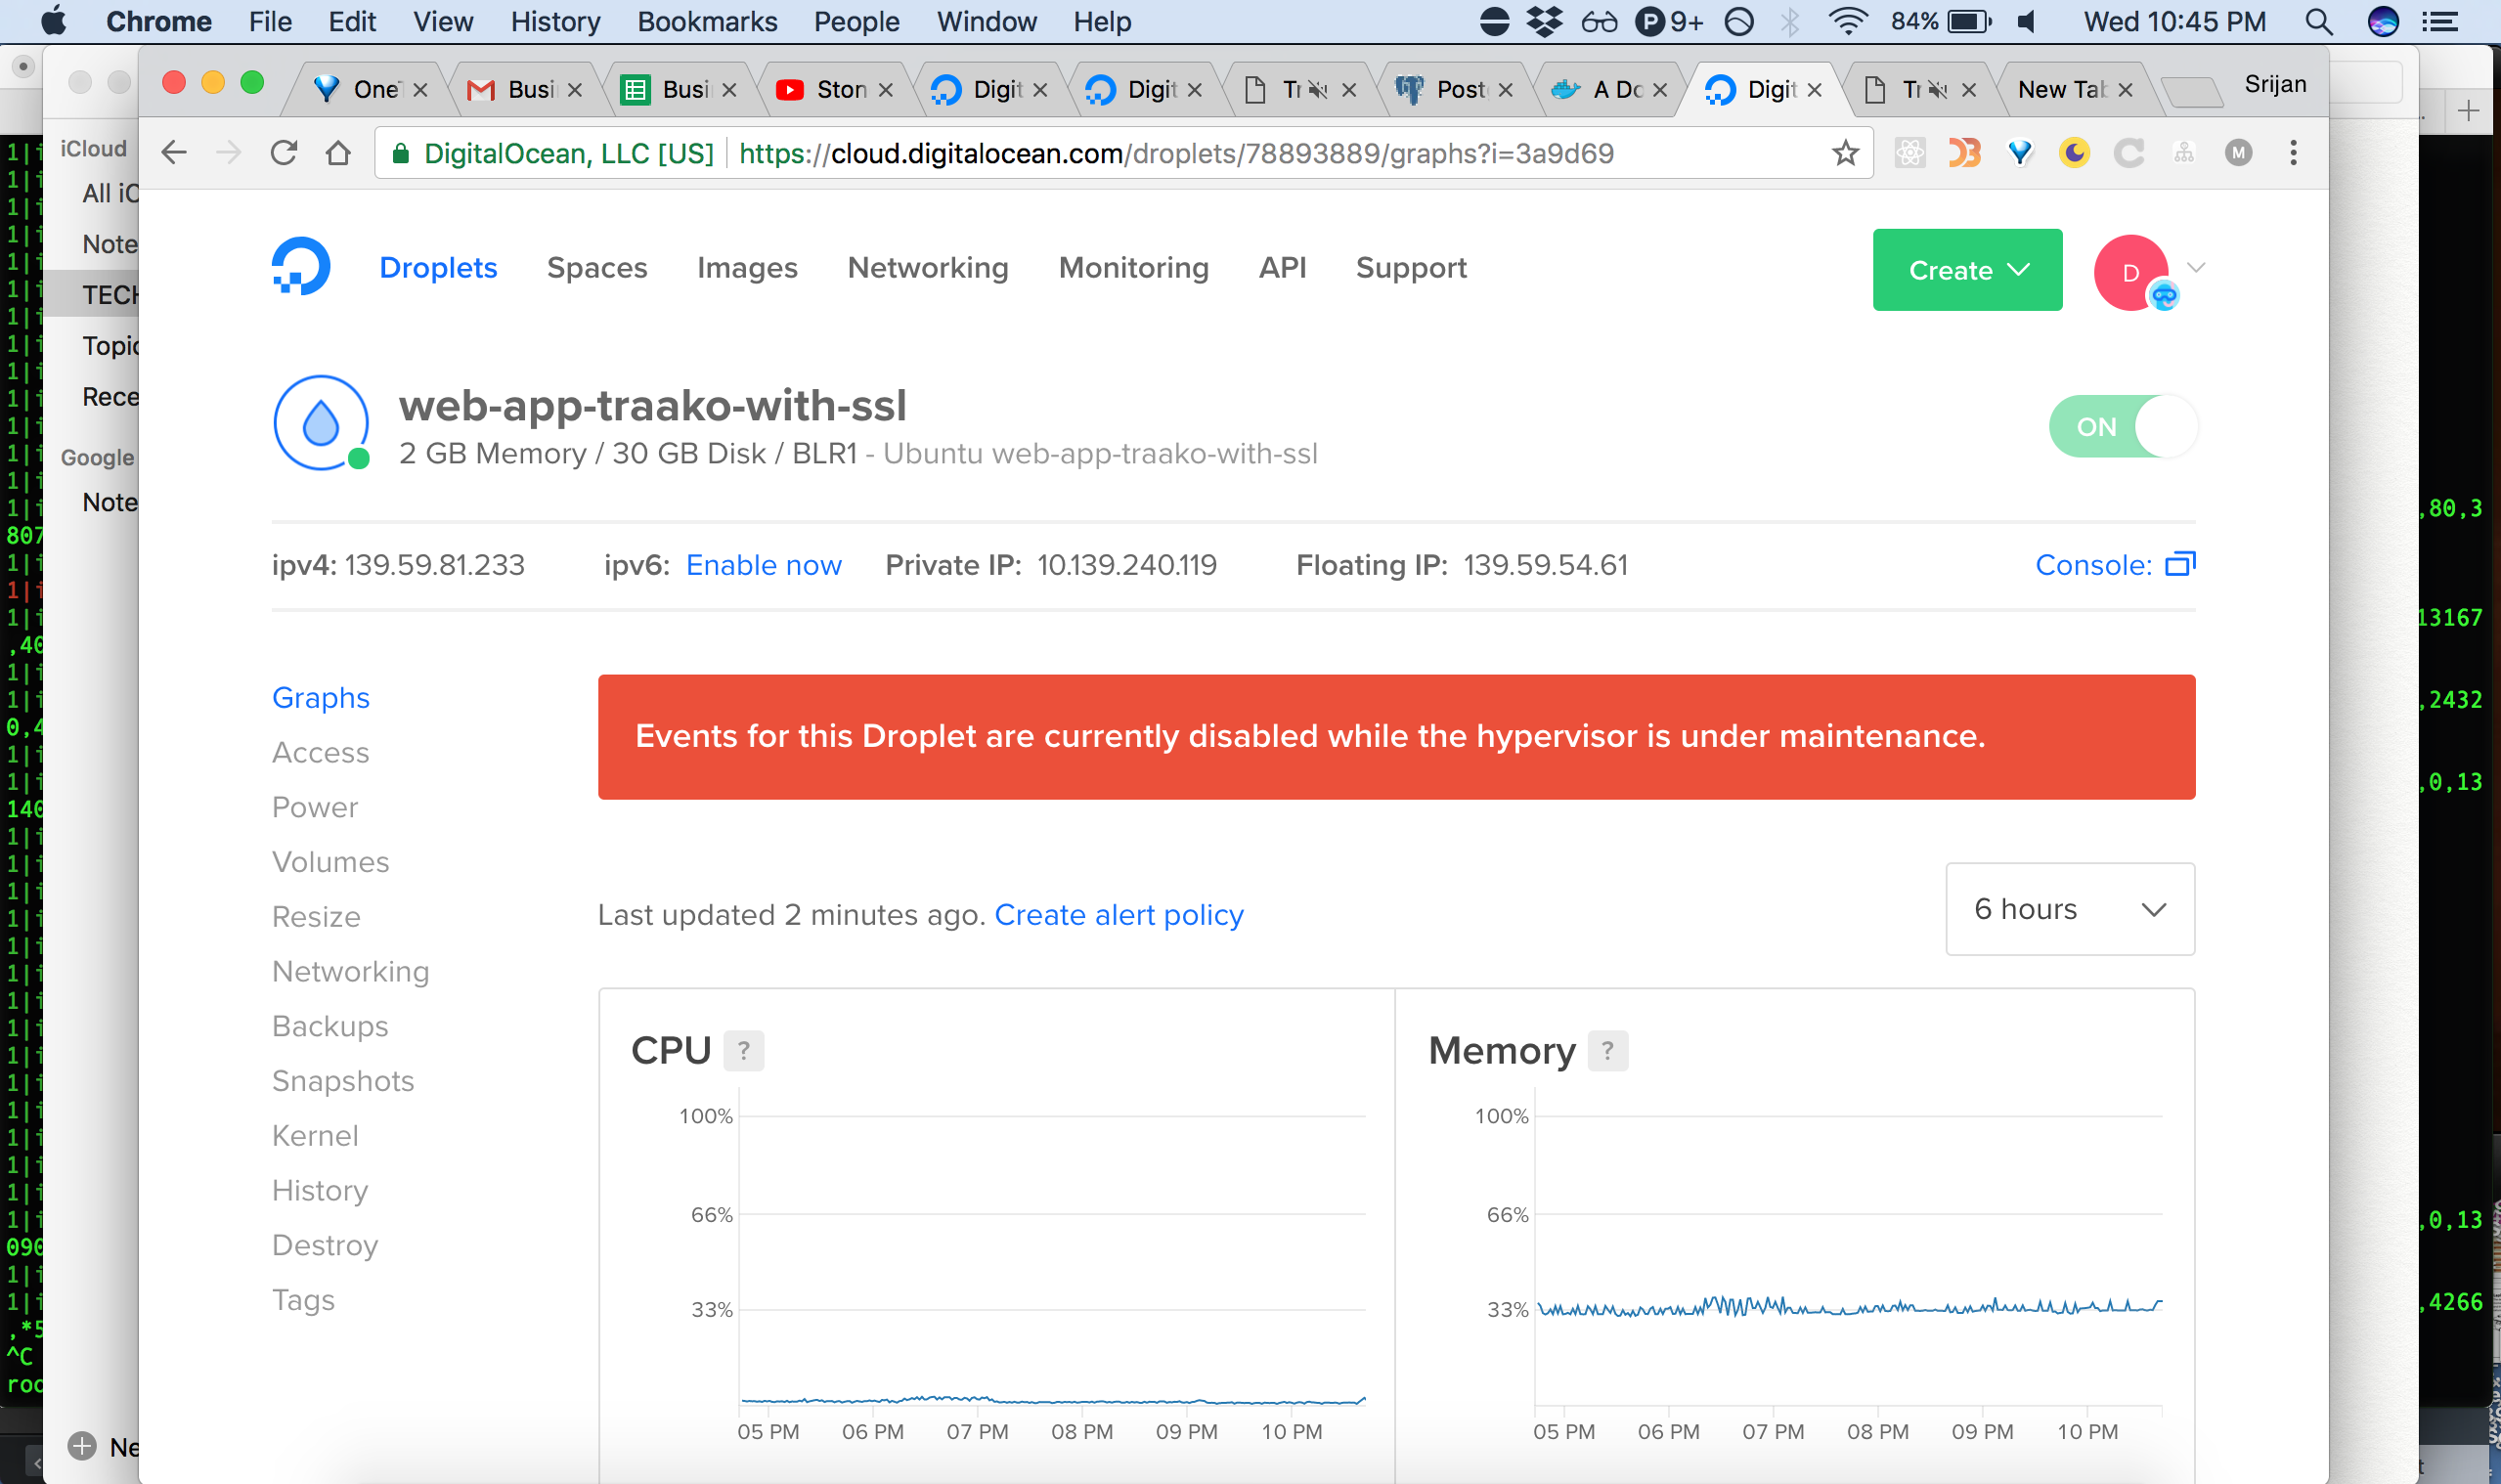
I was not informed beforehand about the reboots for the Spectre and Meltdown vulnerability maintenance.
On Jan 27th we had received an email regarding planned reboots for Spectre and Meltdown vulnerabilities. That email stated: “Notices, including a list of affected Droplets, will be sent to all affected customers at least 24 hours ahead of scheduled maintenance windows.”
On 21st February, our servers went down and I could not SSH into them. I had not received any prior notice about the reboot. Instead, I saw the attached message when I tried to SSH.